Creative trends research
Our client needed to visualize the results of a study on creative trends on their website. The data had to be organized to reflect the complexity of the identified patterns while maintaining clarity and ease of comprehension.
Proposed Solution: Two Visualization Interfaces
After analyzing the study, we proposed creating two interfaces for data visualization: trend cards and a diagram.
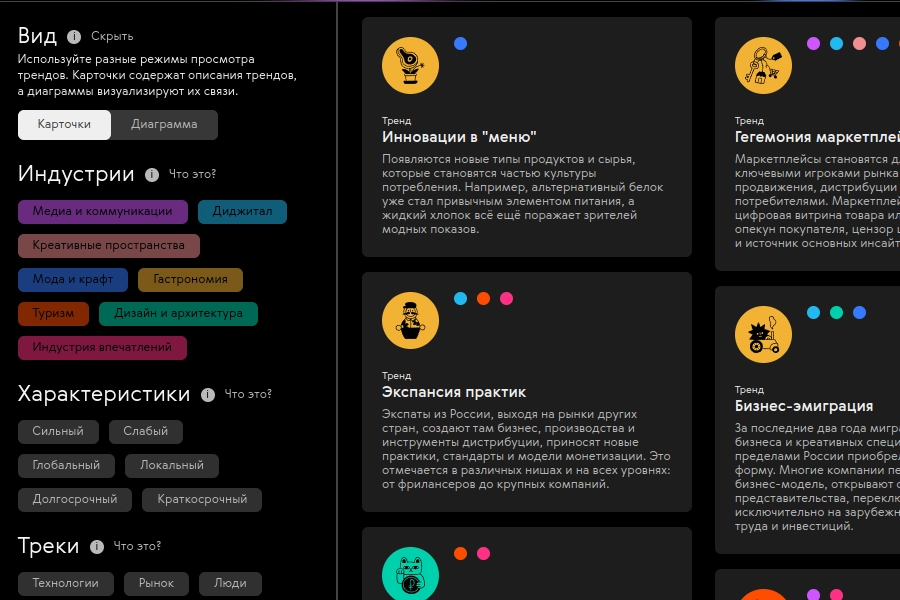
The concept of trend cards was straightforward: display all trends with their descriptions, accompanied by a user-friendly filtering system based on various criteria. This interface allowed users to access all the data in one place and explore it in detail, addressing the need for simplicity and accessibility for the audience.
This approach effectively balanced the complexity of the data with user-friendly presentation, ensuring the results were both comprehensive and engaging.
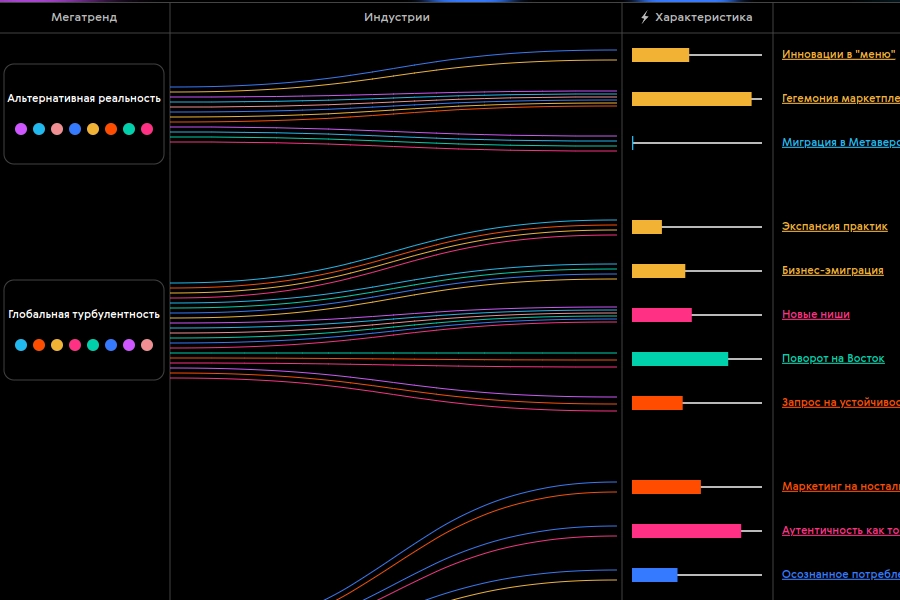
The diagram, on the other hand, enabled the visualization of connections between trends, megatrends, and specific characteristics such as strength, global impact, and longevity. By leveraging this interactive tool, we managed to present the complexity of the research findings in a clear and accessible way.
This approach not only highlighted the relationships and overarching patterns within the trends but also provided users with an engaging and intuitive way to explore the data in depth, making it easier to grasp the nuances of the study.